Telemetry mutation
Some types of mutation include
- Remove a forbidden attribute such as
http.request.header.authorization - Reduce cardinality of an attribute such as translating
http.target value of /user/123451/profile to /user/{userId}/profile - Decrease the size of the telemetry payload by removing large resource attributes such as
process.command_line - Filtering out signals such as by removing all telemetry with a
http.target of /health - Attach information from resource into telemetry, for example adding certain resource fields as metric dimensions
The processors implementing this use case are attributesprocessor, filterprocessor, metricstransformprocessor, resourceprocessor, spanprocessor.
Metric generation
The collector may generate new metrics based on incoming telemetry.
- Create new metrics based on information in spans, for example to create a duration metric that is not implemented in the SDK yet
- Apply arithmetic between multiple incoming metrics to produce an output one, for example divide an
amount and a capacity to create a utilization metric
The processors implementing this use case are metricsgenerationprocessor, spanmetricsprocessor.
Grouping
Some processors are stateful, grouping telemetry over a window of time based on either a trace ID or an attribute value, or just general batching.
- Batch incoming telemetry before sending to exporters to reduce export requests
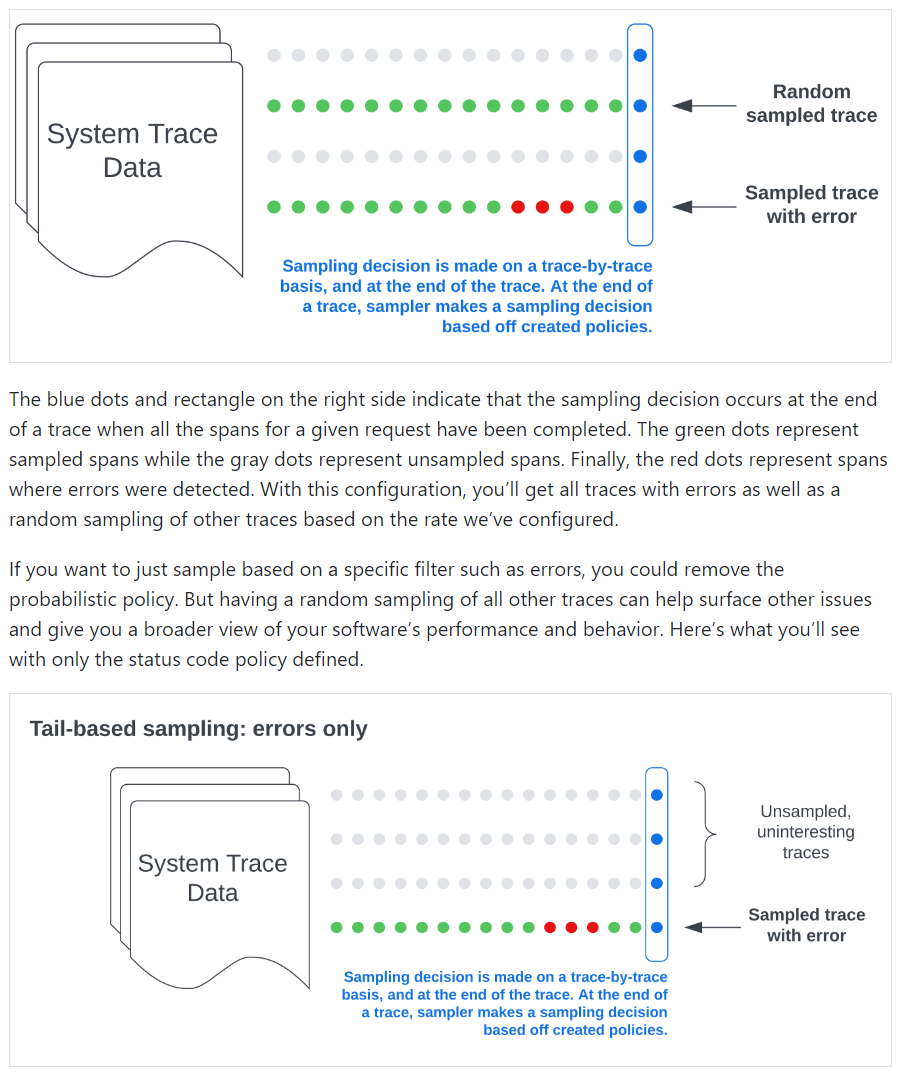
- Group spans by trace ID to allow doing tail sampling
- Group telemetry for the same path
The processors implementing this use case are batchprocessor, groupbyattrprocessor, groupbytraceprocessor.
Telemetry enrichment
commonly used to fill gaps in coverage of environment specific data.
- Add environment about a cloud provider to
Resource of all incoming telemetry
The processors implementing this use case are k8sattributesprocessor, resourcedetectionprocessor.
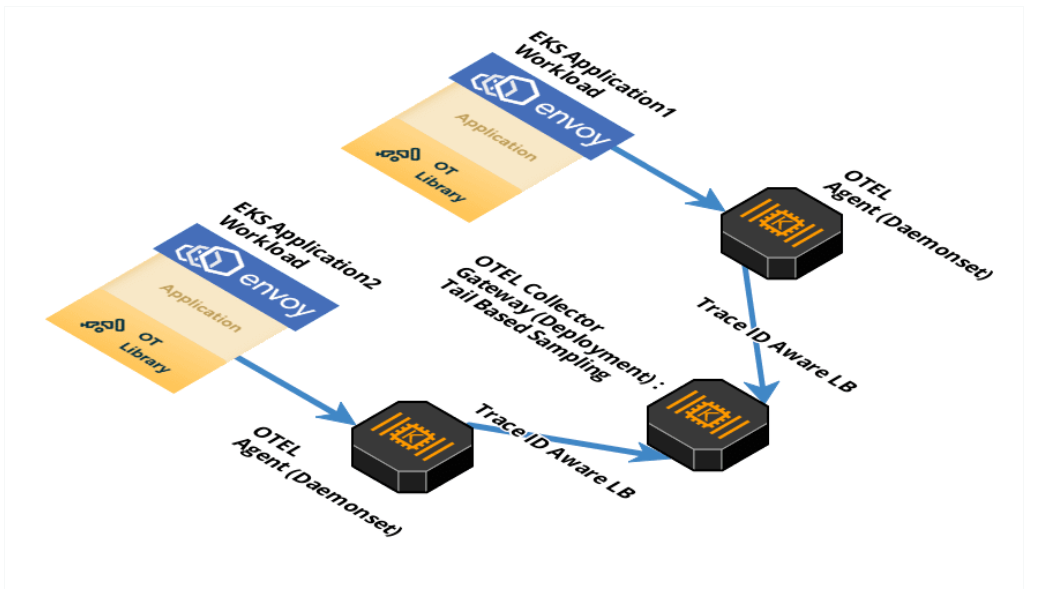
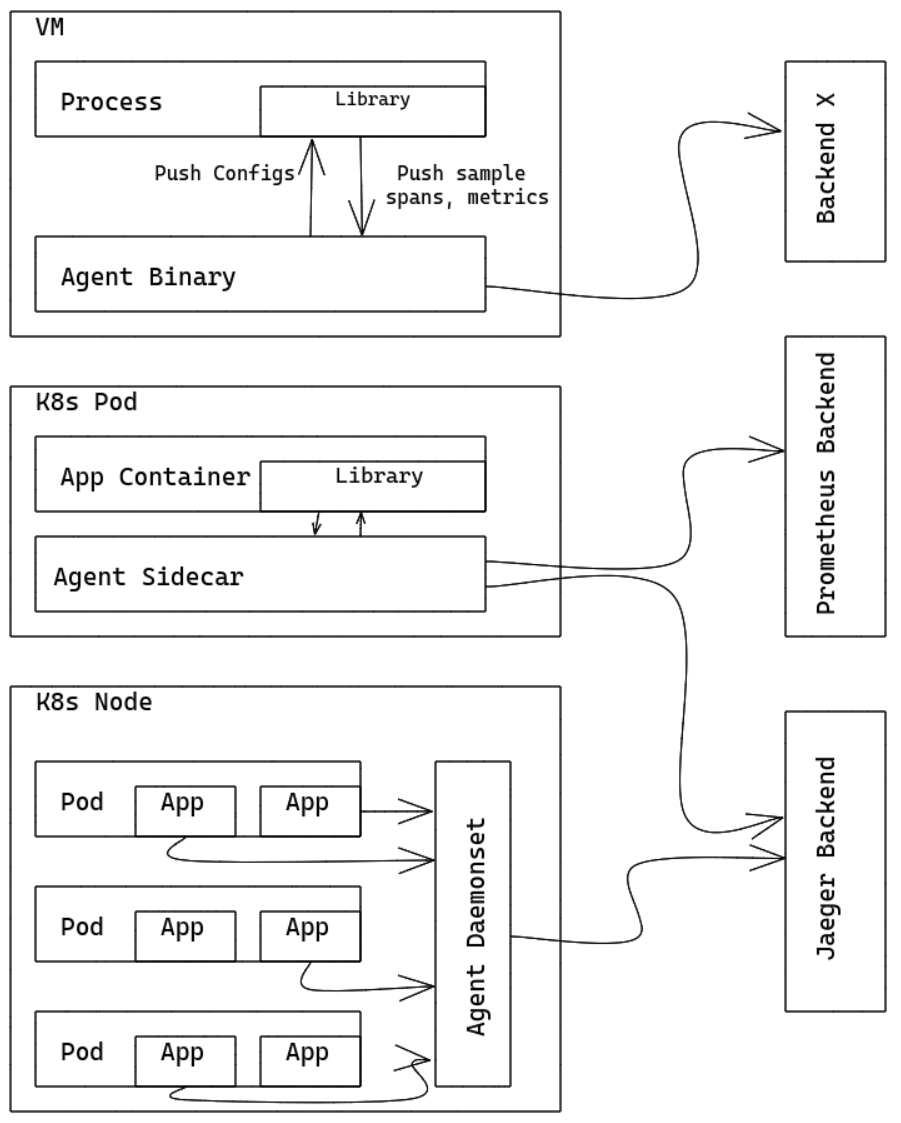 you can run OpenTelemetry Collector as an Agent. The Agent runs as a daemon in the VM/container and can be deployed independent of Library. Once Agent is deployed and running, it should be able to retrieve traces/metrics/logs from Library, export them to other backends.
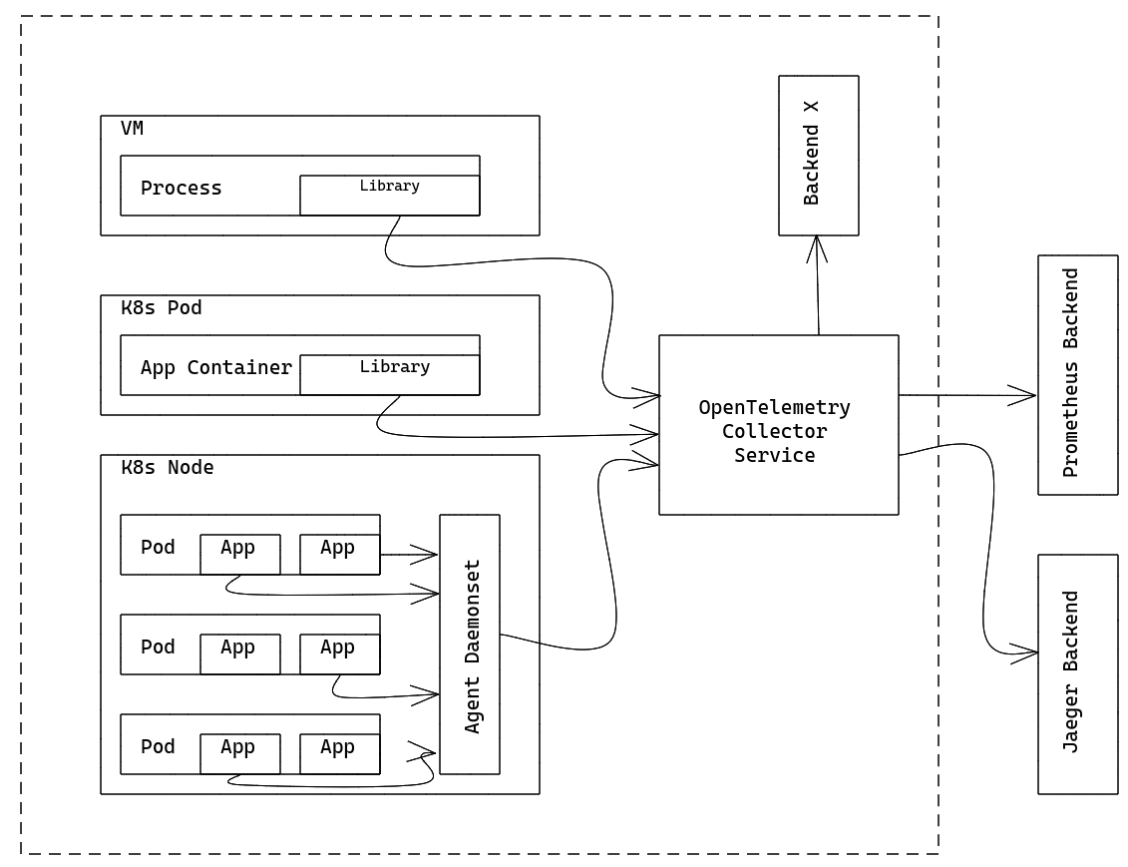 The OpenTelemetry Collector can run as a Gateway instance and receives spans and metrics exported by one or more Agents or Libraries, or by tasks/agents that emit in one of the supported protocols. The Collector is configured to send data to the configured exporter(s).